Dataset

Data Collection

Event date, location, businesses close-by and transportation accessibility are all possible key factors.

This analysis provides valuable insights into understanding people’s decision-making process and day-to-day scheduling. It is especially useful for any hosts to better market their events and attract as many people as possible with shared interests.

According to the Bizzabo Blog, 41% marketers believe that “events are the most effective marketing channel over digital advertising, email marketing and content marketing.” Event-directed marketing strategies increased by 32% since 2017.

There are plenty of traditional statistical analysis conducted on event marketing and management, but little is done through comprehensive machine learning. Our predictive approach captures a wide range of variables by conducting geospatial analysis, predictive modeling and text analysis through the combination of three very different data sets. It adds valuable business strategies to the current event marketing and management industry.

Next

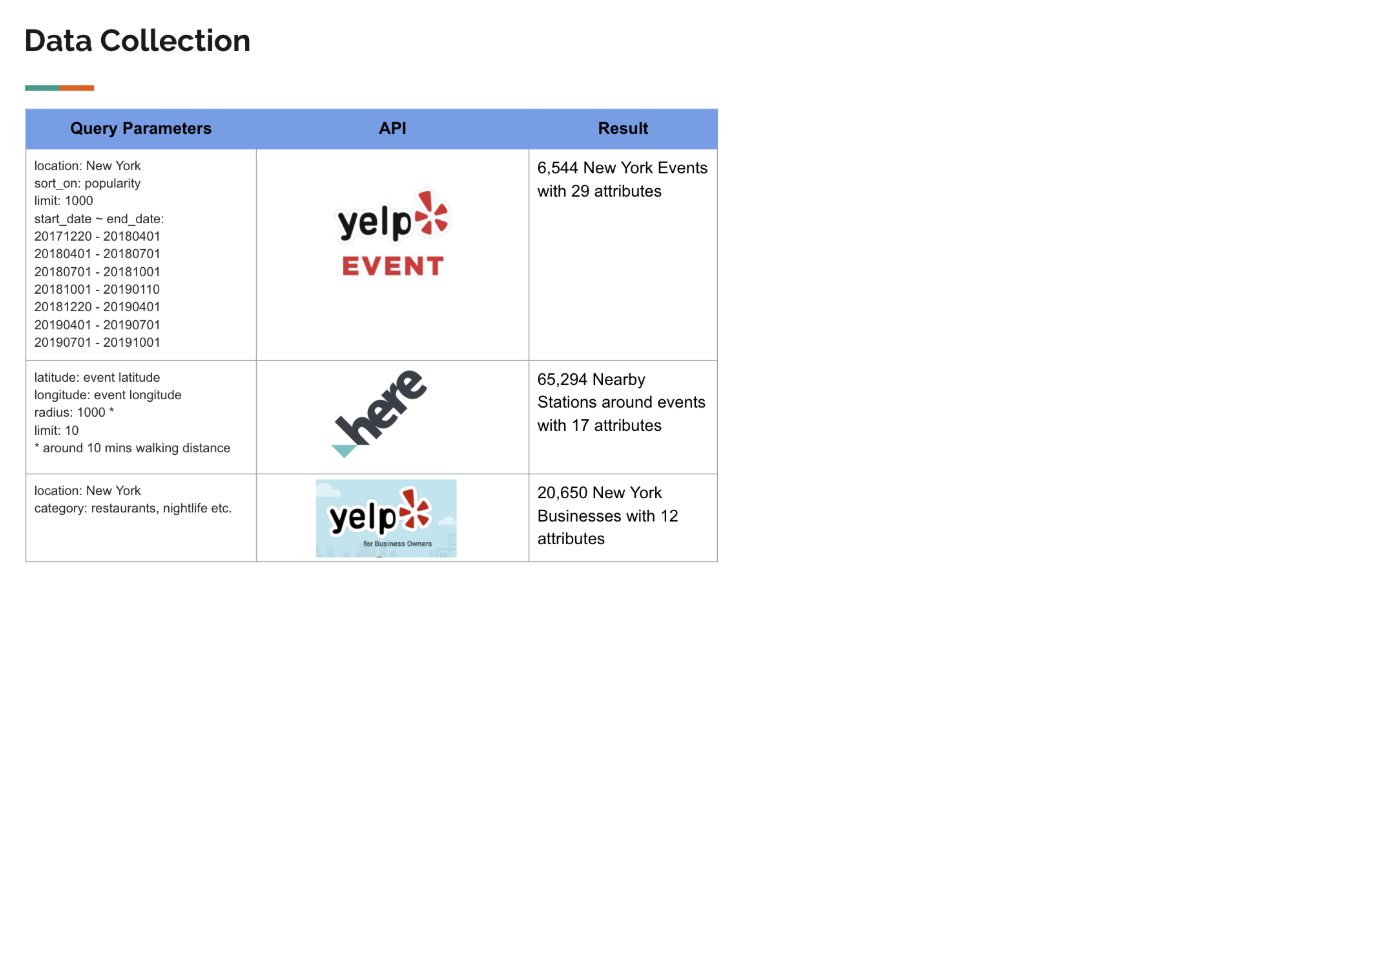
6,544 events in New York State are selected as target.

To further understand what makes an event attractive, we use Yelp Events data as the primary source, and supplement it with Yelp Businesses data and Here Technologies public transportation data.

Next

Data Manipulation

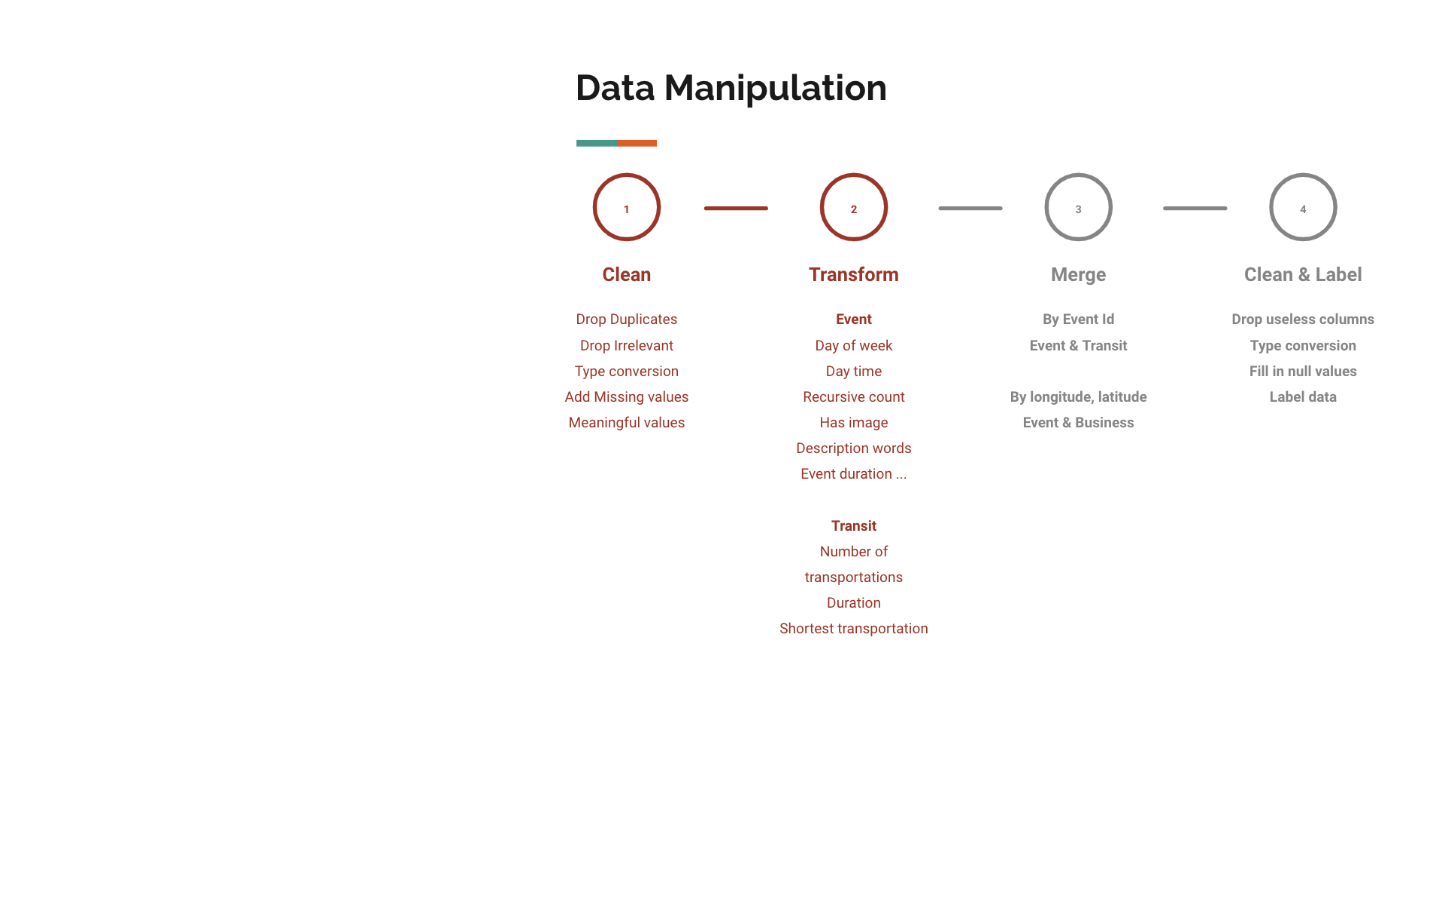
Our data manipulation process has four stages: data cleaning, transformation, merging, and labeling. During the first stage data cleaning, we removed duplicates, irrelevant values and missing values. In the second stage, we created a series of new variables that are beneficial to the objective of our study, from the events and transit data sets. For example, we divided the timestamp into day of the week and time of the day. In the merging stage, we combined events, businesses and transits data sets into one by first joining event and business by event id and then joining event and transit by latitude and longitude. In the final stage, we converted the data type to the correct ones, filled the null values with zeros, and labeled all variables.

Next

Different techniques are used to analyze this problem.

Unsupervised: Association Rules, Clustering, Topic Modeling
Supervised: Classification and Regression
Statistical Approach: Hypothesis Testing

Next

Dataset

6,113 events in New York State are selected as target.

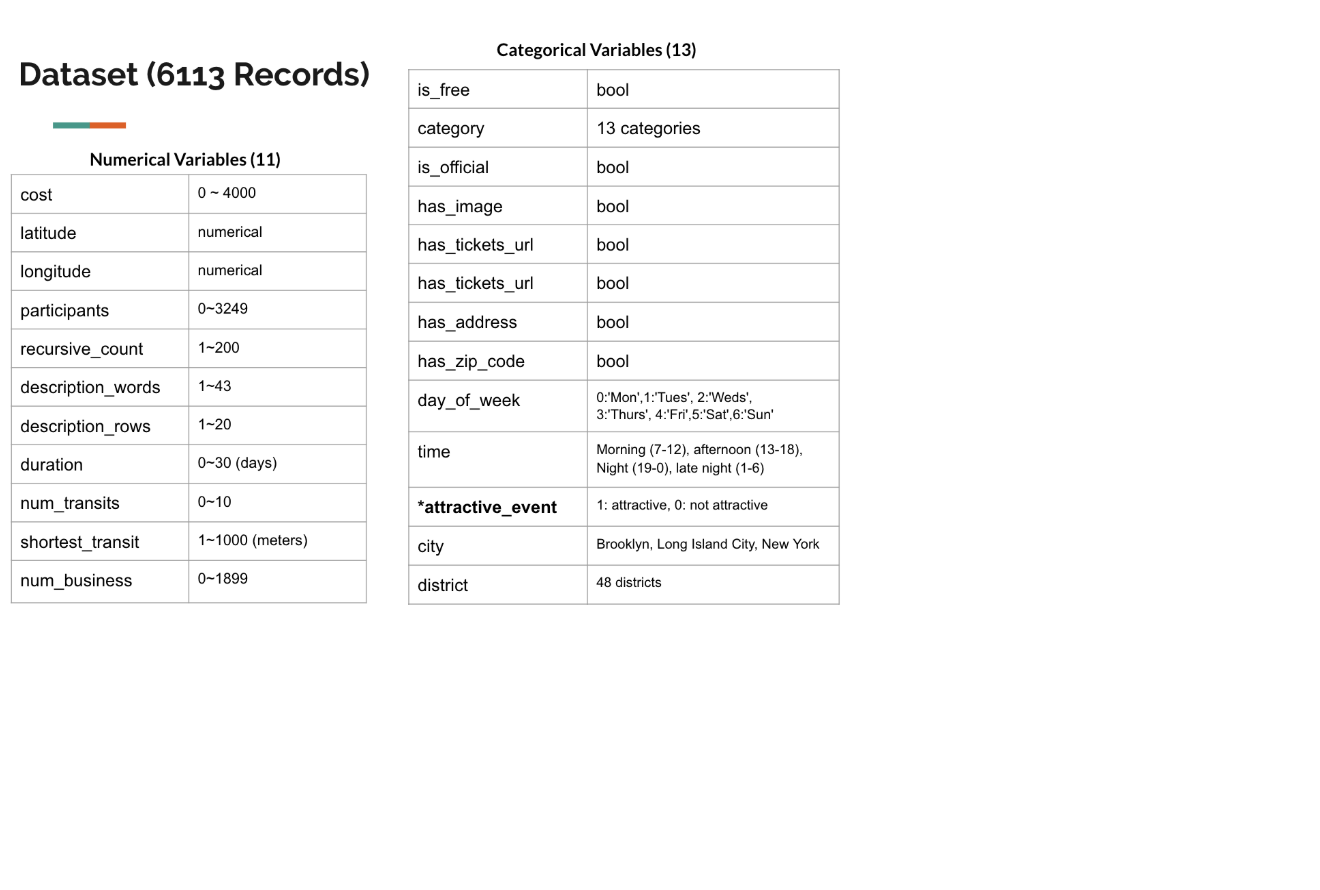
- Our data has 11 numeric variables and 13 categorical ones. Their name and basic information are listed in the table on the left. Our variables generally include four types: time variables such as day_of_week that indicate when the event is happening, space variables such as latitude and num_transits give us information about the location of the event, cost variables such as is_free provide information about how much an event costs, and other theme/content variables such as category or has_image. Later in the Analysis section, we will discuss each aspect’s effect on understanding the event’s attractiveness.

Next

Data Issues

- Dirty data. A lot of our variables are skewed. This is demonstrated by the box plots in the exploratory section. Some of our Boolean variables only have a few counts of one value, which also adds to the unbalance of our data. This issue might lead to an abnormally large amount of outliers, and makes it hard for clustering algorithms to detect communities.

- Lack of informative variables. Ideally, we want the percentage of attendance over user registration counts. However, this information is not available to us because people do not always check in on their App. Therefore, our main variable of interest is a boolean variable “attractive_event” created by slicing over the attendance count.

- False information. The attendance count, where we derived the attractive_event variable, could be significantly lower for some events and might not reflect the actual attendance.

Next